Data Analytics and Visualization
Transforming Data into Actionable Insights with Powerful Visuals
What We Offer
Data Analytics
We analyze large volumes of structured and unstructured data to uncover actionable insights. Our data analytics services help businesses identify trends, predict outcomes, and make data-driven decisions to improve efficiency and drive growth.Business Intelligence (BI) Solutions
We create custom BI solutions that enable businesses to visualize key metrics and KPIs. Our BI dashboards and reporting systems allow you to track performance and make informed decisions quickly, all in real-time.Data Visualization
We design interactive data visualizations that make complex data easy to understand. Using tools like Tableau, Power BI, and custom dashboards, we help businesses present their data in visually compelling ways that are easy for both technical and non-technical users to grasp.Predictive Analytics
Our predictive analytics services help businesses forecast future trends and outcomes based on historical data. We use machine learning models and statistical techniques to provide insights that help you plan for the future with confidence.Real-Time Analytics
We help businesses stay ahead of the curve with real-time analytics solutions that enable immediate insights. By analyzing streaming data, we provide businesses with the ability to react quickly to market changes and operational events.Why Choose Codeex for Data Analytics and Visualization?
Expertise in Data Analysis Tools
Our team is proficient in using a wide range of data analysis and visualization tools, including Tableau, Power BI, D3.js, and Python libraries, ensuring your data is presented in the most impactful way possible.Tailored Visualizations for Your Needs
We understand that every business has unique requirements. We provide custom data visualizations that align with your goals, making it easy to interpret complex data and derive insights specific to your business context.End-to-End Analytics Services
From data collection and cleaning to visualization and reporting, we provide comprehensive analytics services that ensure your data is accurate, actionable, and ready for decision-making.Business-Focused Insights
We don’t just visualize data—we turn it into clear, actionable insights that support strategic decision-making and drive measurable business outcomes.How We Work
Our software development process is designed to ensure that every project is executed with precision and excellence.
Consultation
Diving into your vision and unlocking the full potential of your unique ideas.
Planning
We map a strategy based on your specific requirements.
Development
Crafting scalable software solutions that evolve with your needs using expert software engineering and development services.
Testing
Making sure every line of code delivers excellence.
Delivery & Support
Ongoing assistance for long-term success with continuous support to maintain high-performing systems.
Proven Results
50+
Successful projects delivered across multiple countries and industries
30%
Reduction in օperational costs through optimized custom ERP software development
90% +
User retention rate with custom-built applications and real-time systems
Showcase of Our Work
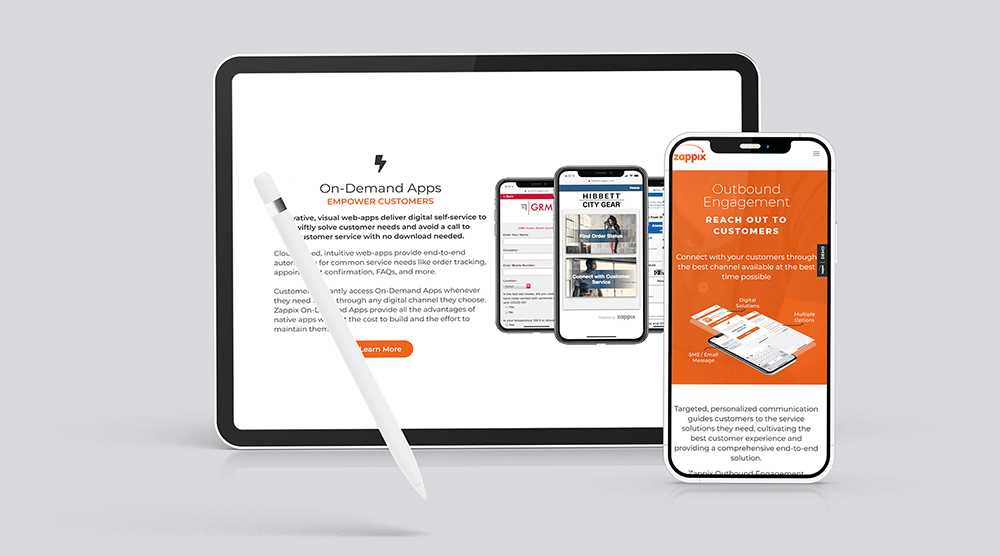
Zappix
Zappix provides Mobile On-Demand solutions that transform the user journey during contact center interactions using Visual IVR.
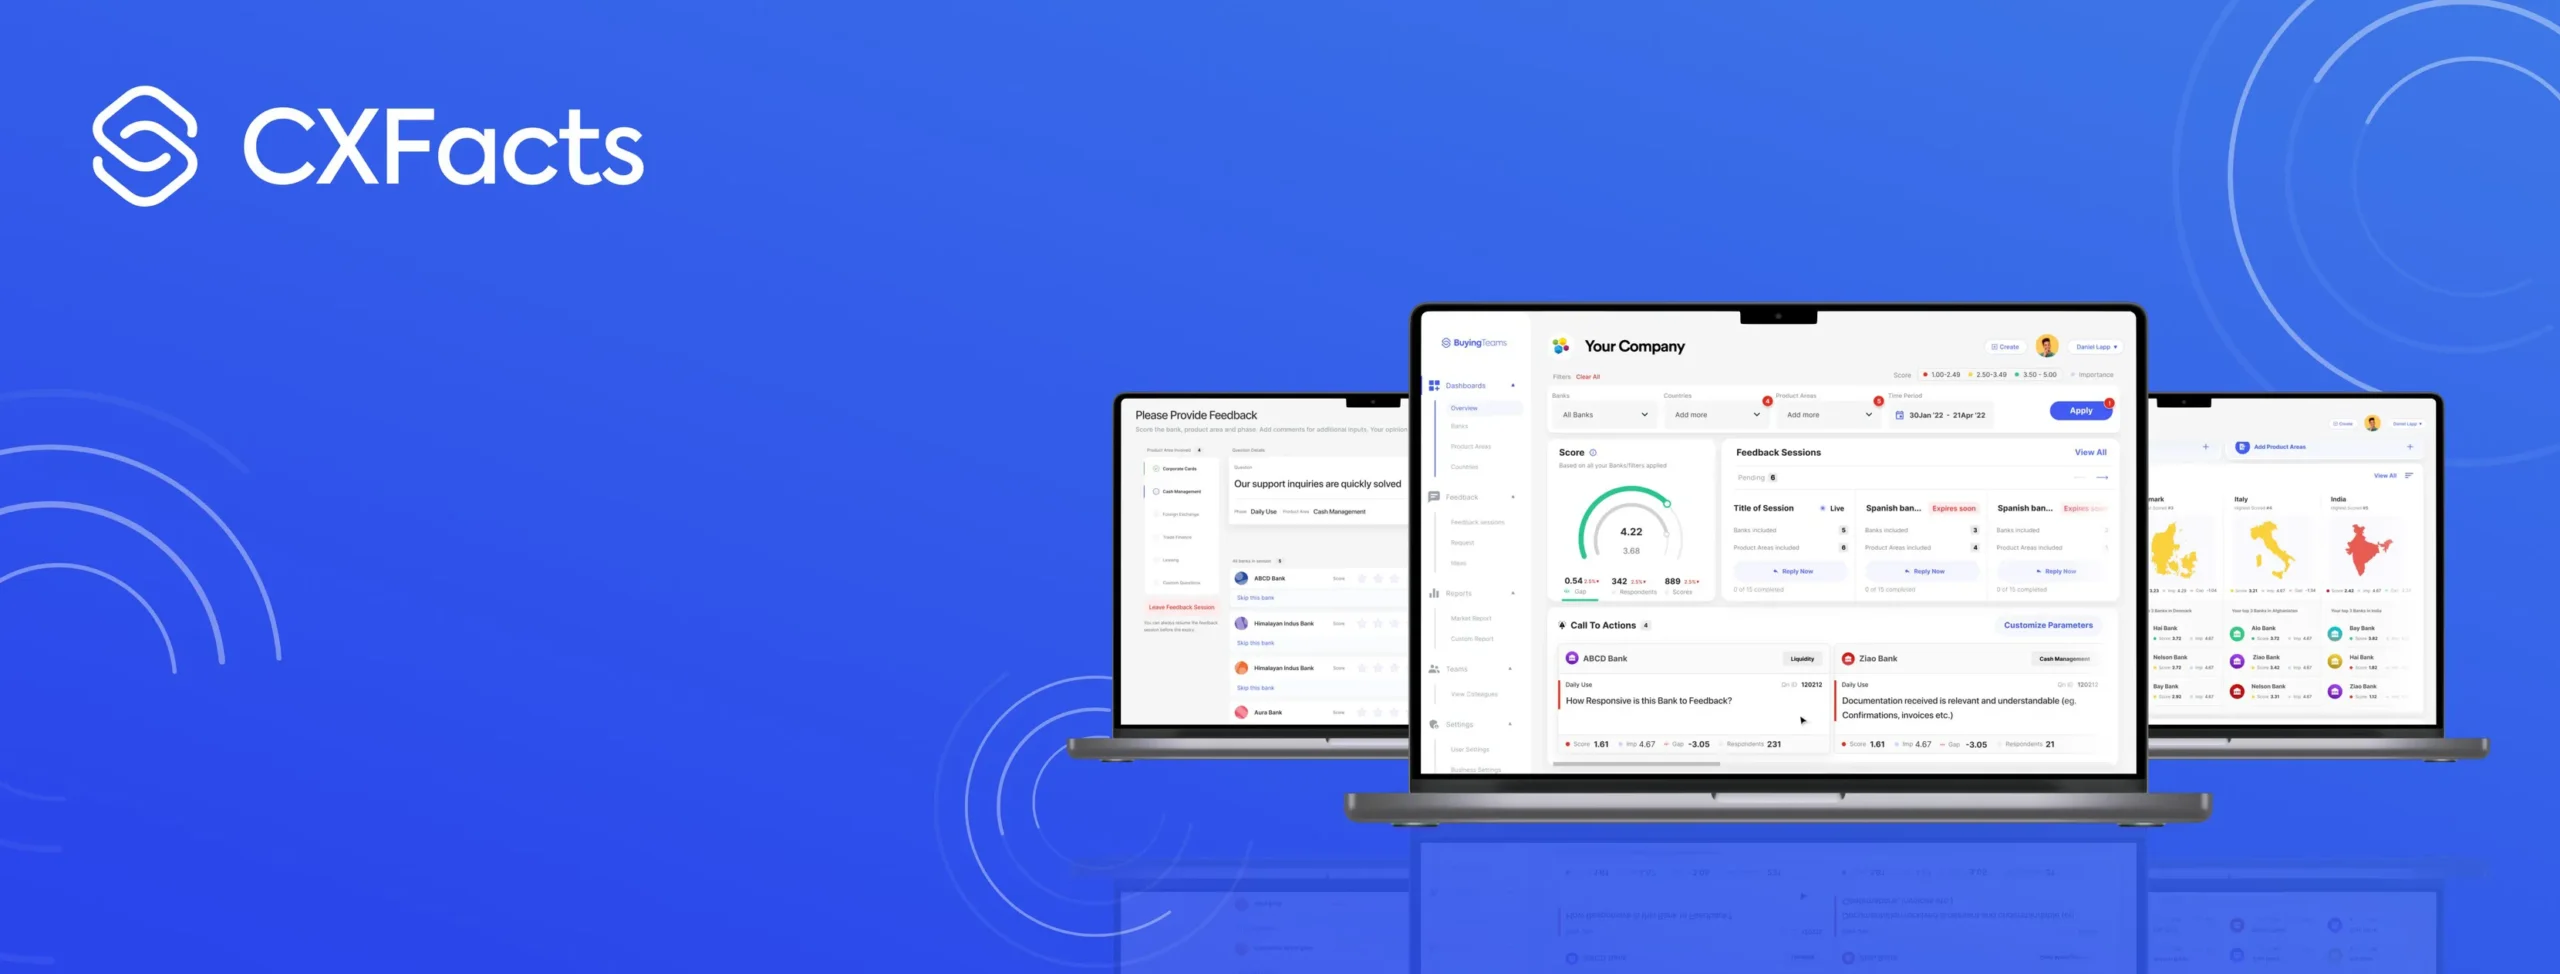
CXFacts
Enhancing feedback and collaboration between suppliers and customers.

Email Security Solution
Advanced email security solution to protect businesses from phishing, spoofing and email threats.
Industries
We provide comprehensive IT solutions across a wide range of industries. Our expertise allows us to deliver tailored, innovative technologies that drive efficiency, growth and success for businesses of all types.
Financial & Healthcare Solutions
- Finance & FinTech
- Healthcare
- E-Commerce & Retail
Creative & Media
- Media & Entertainment
- Marketing
Business Solutions
- Telecommunications
- Enterprise
- Manufacturing
- Logistics & Supply Chain
- Automotive
Public & Service
- Government & Public
- Sector
- Agriculture
- Travel
- Real Estate
What They Say About Codeex
They take full ownership and act as a stake owner in the project.
With the help of Codeex, the client has launched the project on time, and it was received well by the market. Through Jira, the team has communicated daily and weekly updates with the client. They are a great company to work with, and successful engagements are the hallmarks of their work.
Dec 4, 2022
They engage with the features and UX/UI design, so they make the best products.
Internal stakeholders are satisfied with Codeex’s performance. The team has been professional; they’ve exceeded expectations and delivered beyond the technical aspects. Overall, they understand the requirements and client goals, communicate well and are highly responsive.
Nov 30, 2022